
Infection forecasts are at the heart of VineForecast. In this article you will learn more about the modelling, interpretation and use of disease forecasts in VineForecast.
The calculation 🧮
The weather 🌦
The development of diseases is largely determined by the weather and so all forecasting models for Powdery or Downy Mildew are based on weather data. In order for risk indices for infections to be modelled correctly, the weather must first be considered.
VineForecast obtains raw data from the German Weather Service (e.g. temperature, precipitation, humidity, etc.). Ideally, however, this data is only resolved to 1 - 2 km. If this raw data were fed into a disease model, the accuracy would be low. To increase the accuracy, VineForecast uses a method from climate physics.
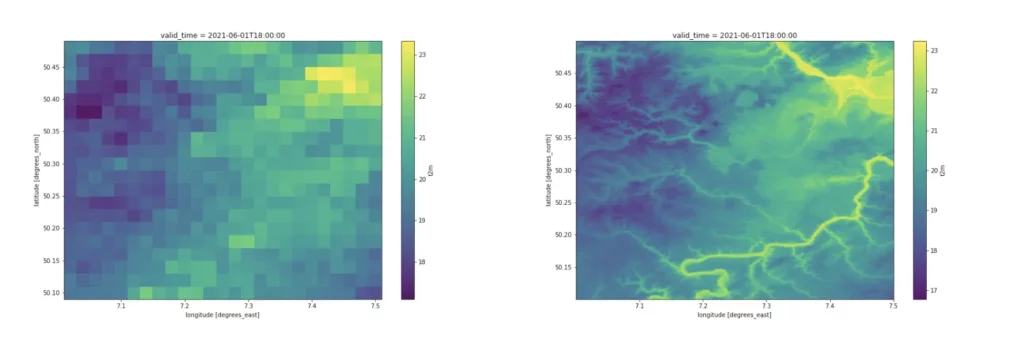
The Downscalingor regionalisation, makes it possible to include regional influencing factors in the weather forecast. Among other things, VineForecast takes into account the local topography with a resolution of 50 metres when adjusting weather data. This allows the effects of different altitudes or slope inclinations to be included. The effect is illustrated by the following example of temperature adjustment.
Infection modelling 🍄
In addition to the weather, the Phenology another crucial basis for calculating infection. VineForecast calculates the phenology on the basis of temperature sum models. For example, the BBCH stage is calculated based on research by Molitor are calculated for different grape varieties. For the number of leaves, we orientate ourselves on the Geisenheim model from Schultz. The infection prognosis is adjusted depending on the stage of the season. Around flowering, for example, the susceptibility to infection with Powdery Mildew is considered to be significantly increased.
The modelled phenology is not set in stone, but you have the option of changing the Correct model.
After VineForecast has calculated the two influencing factors (regionalised weather, phenology) separately, these can now be converted into infection risks using disease models from viticulture research.
For Powdery Mildew We orientate ourselves on the OiDiag Index according to W. K. Kast and make specific adjustments based on further research, our data sets, field trials and experience.
With the Downy Mildew forecast VineForecast uses different models depending on the phase. Oospore germination and primary infection are analysed according to the methodology of Caffi & Rossi calculated. Secondary infections are modelled using the leaf wetness hours (BNG) indicator. The risk index is calculated from the sum of the temperatures during hours with leaf wetness. If the value is between 75-125, there is a moderate risk of infection. If the BNG is between 125-200, a medium risk of infection can be assumed. Values above 200 indicate a high risk. In addition, the susceptibility and the phenological stage are taken into account and these limit values are adjusted accordingly.
The effect that the adaptation of weather data to local conditions has on the disease forecast is reflected in the following image. The figure shows the calculation of BNG on the Moselle.
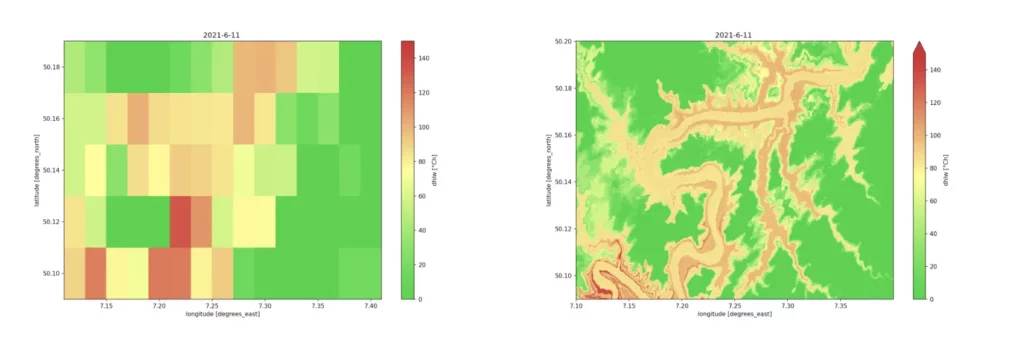
The figure on the left shows that a weather forecast with raw data leads to a very inaccurate resolution of the disease forecast. The figure on the right shows the prediction of BNG by the VineForecast model. The effects of topography on the risk of infection are visible here. For example, VineForecast reveals higher infection risks in the side valleys of the Moselle due to the regionalisation described above, while the model with the raw data does not recognise these effects.
Weather stations generally use models with a resolution of at least 1 x 1 km for forecasting and would refer to the calculations in the figures on the left. This means that although the station can guarantee an accurate recording of the actual state, it is very inaccurate when forecasting the future. See here for more information:
Why no weather station helps with preventive plant protection
The representation 📊
Of course, VineForecast does not generate complex maps for the users of the software, but communicates the calculation described above as simply and purposefully as possible. The risk display is shown in the form of a traffic light scheme:
No risk of infection
Low risk of infection
Medium risk of infection
High risk of infection
Potential infections can occur from a low risk of infection. However, it only becomes really dangerous from a medium risk of infection and it is definitely advisable to act here.
On Forecasts -> Stations will give you a quick impression of the current overall situation. Here you can see all the infection risks for your virtual weather stations.
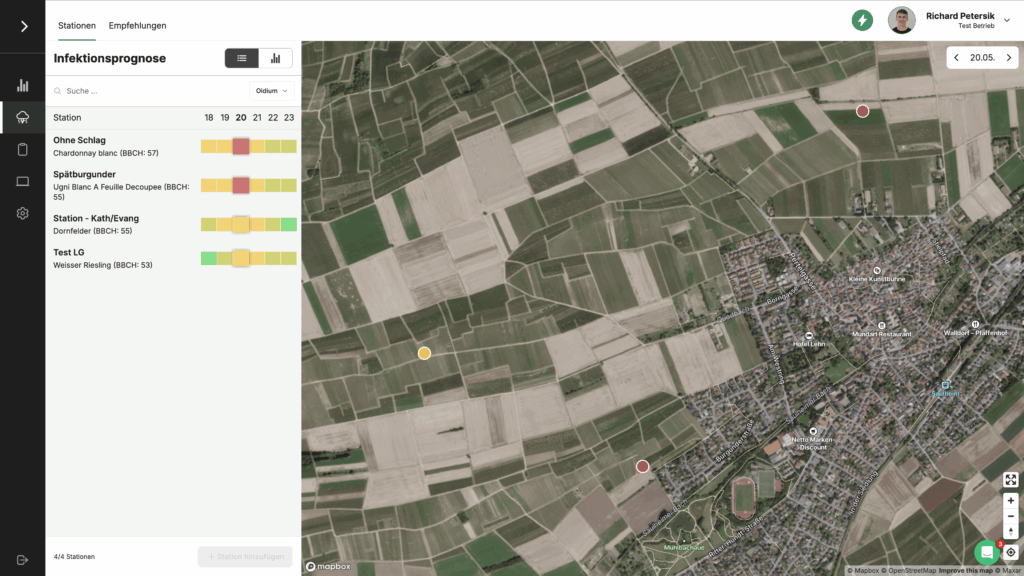
The rectangles in the sidebar on the left always represent a day of the infection forecast and the colours reflect the infection pressure in the colour scheme described above.
By default, a display from yesterday to a forecast up to four days from now is always shown. In the example above, a period from 18 May to 23 May is displayed. You can also use the drop-down menu in the sidebar on the left to change the illness displayed.
The positions of your virtual stations are displayed on the map on the right and the infection pressure is highlighted in colour. At the top right of the map, you can also change the day for which the disease forecast should be displayed.
If you click on a virtual weather station, either on the map or in the sidebar, you will be taken to the details page where you can see all the information about the current situation. Click on the Diseases tab at the top for more details on the infection forecast at that location.
This page provides you with even more context on the current infection situation. You can view the following data here:
- Risk of infection for Peronospora
- Risk of infection for Oidium
- Leaf surface
- Growth
- Leaf wetness in h
- Max. temperature
- Min. temperature
- Precipitation
- Air humidity
- Grape variety susceptibility (in the "Seasonal progression" box)
- Information on the season phase (in the "Season progress" box)
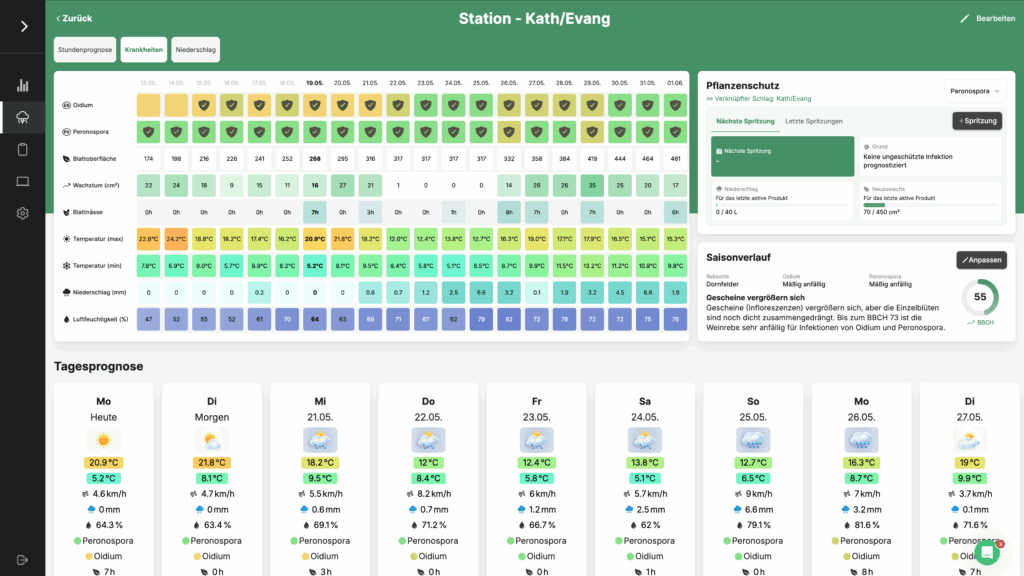
You will also find a recommendation on how to deal with the current situation in the "Plant protection" box on the right-hand side. You can find out more about this in our article on VineForecasts "Recommendations for action„