Infections with Powdery or Downy Mildew are largely dependent on the weather. In addition to the Infection prognosis the heart of VineForecast. In this article you will learn more about the modelling, interpretation and use of weather analyses in VineForecast.
You can access the weather page via Forecasts -> Weather.
The calculation 🧮
The basis ▶️
To understand how weather forecasts are actually produced, we first need to delve a little deeper into the subject. It is sometimes assumed that the nearest weather stations provide the weather forecast for the region. In reality, however, complex weather models are behind the weather forecast.
The forecasts are calculated several times a day by national and international weather services on their supercomputers. A weather model is used to calculate the development of the weather in the coming hours and days. Our basis for the weather models comes from the German Weather Service (DWD).
Downscaling of the weather data 📍
The higher the resolution of a weather model, the more computing capacity is required. This is why most weather models currently have a resolution of 1km x 1km at best. For forecasts that go several days into the future, however, the resolution is often significantly lower. The DWD's ICON-EU model, for example, has a resolution of approx. 6km x 6km and extends up to 180 hours into the future. The higher-resolution ICON-D2 model has a resolution of approx. 2km x 2km, but only extends 48 hours into the future.
This resolution is often perfectly adequate for estimating the general development of the weather in the coming days. It becomes problematic when you are interested in the specific microclimate at a particular location. As the forecast values from the weather models tend to represent averaged values over a wide area, these can sometimes deviate significantly from the actual values at a specific coordinate. This problem is particularly pronounced if the forecast point is located in a region with a complex topography.
To correct these errors in the forecast, VineForecast uses so-called downscaling. Downscaling). Statistical correlations between the topography and the microclimate are used to better calibrate the weather forecast to the local topography. In viticulture, for example, a difference of 2-3 hours in the duration of leaf wetness can have a major impact on the risk of infection with Downy Mildew. This is why the weather forecasts from VineForecast are first downscaled before they are used in disease modelling.
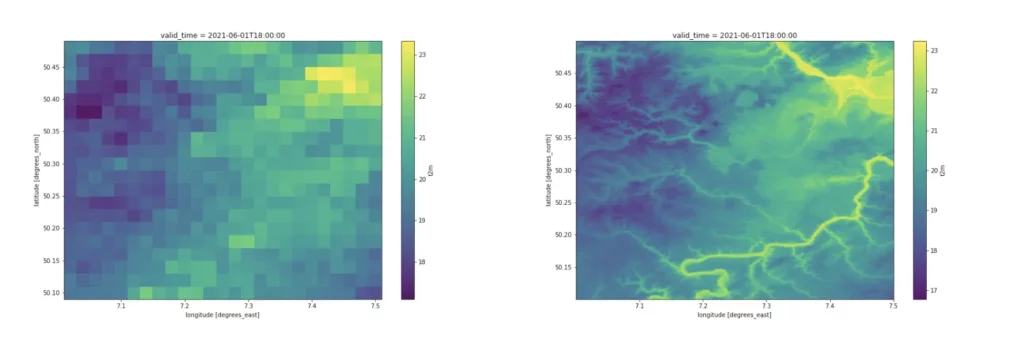
An example of the downscaling of the temperature at a height of 2 metres can be seen in Figure 2 below. On the left is the standard weather forecast from the DWD's ICON-D2 model (2km x 2km resolution), while the downscaled forecast from VineForecast (25m x 25m resolution) can be seen on the right. Incidentally, the Moselle valley is located in the south-east of the map, which is clearly visible in the downscaled forecast.
Comparison of 40 weather models 📊
In addition to downscaling, we not only use one weather model but also work with so-called ensemble models. Ensemble weather forecasts are a series of forecasts that represent the range of future weather possibilities. Several simulations are carried out, each with a slight variation in the initial conditions. In VineForecast's case, 40 different predictions are compared for each plot created in the system in order to provide the most valid statement possible for a wide range of locations.
Simply put, a prediction is largely reliable as long as the change in the initial condition does not lead to any major differences in the various models. If the change in the initial condition leads to major differences in the individual prediction models, it can be assumed that the prediction is still very uncertain.
The representation 🟢 🟡 🔴
But don't worry, you don't have to check 40 different graphs. We will analyse the data for you. To make the analysis described above as simple as possible, we work with a traffic light code, as with the infection forecasts.
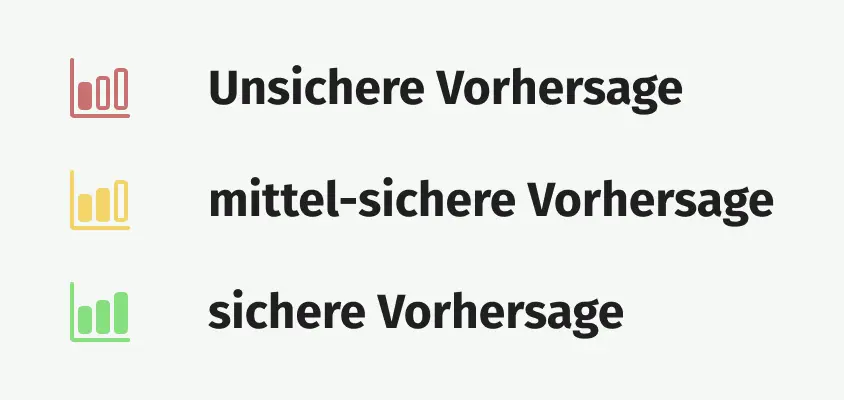
You will always find an indication of how reliable the forecast is after the individual weather data. If it is a reliable forecast, you will always be shown a value. In the case of a medium-certain and uncertain forecast, you will always see a range between the minimum and maximum value. In the following example, you can see the different safety values of the forecast in the live system.
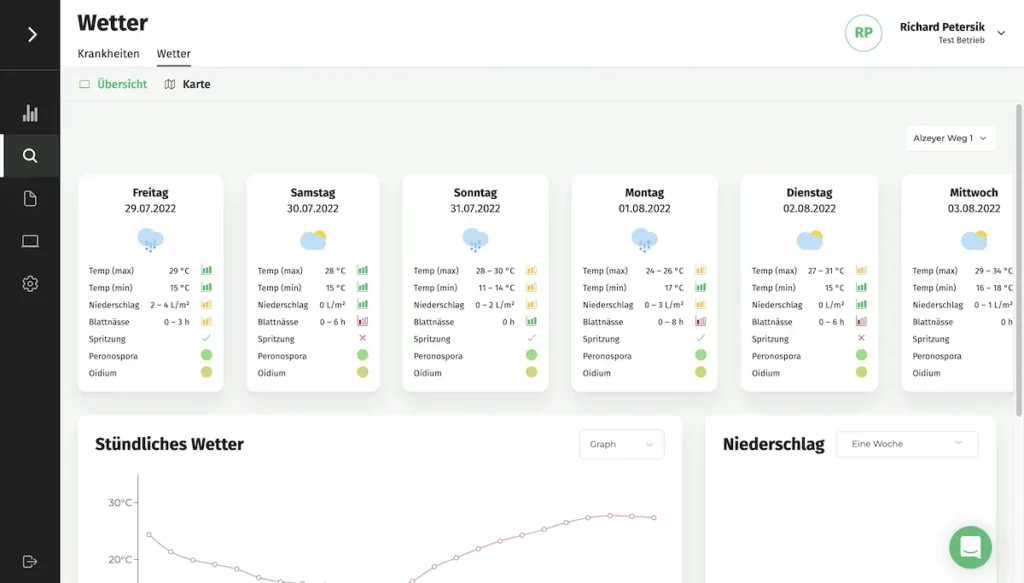
You can switch between the individual plots in the top right-hand corner and view your forecast data for different locations. If you just want to take a quick look at the app to get a quick impression, simply select Summary out. In this way, you get your data summarised across all vineyards and a kind of "average forecast".
The weather data 🌦
Temperature 🌡
VineForecast calculates the maximum and minimum temperature, including safety information, by comparing 40 weather models. You can find the temperature data both on the homepage and under Forecasts -> Weather above in the small boxes. You can also view a detailed 24-hour forecast in the box Hourly weather view.
Precipitation 🌧
VineForecast calculates the maximum and minimum precipitation, including safety information, by comparing 40 weather models. You can find the precipitation data both on the homepage and under Forecasts -> Weather above in the small boxes. You can also view a detailed 24-hour forecast in the box Hourly weather view.
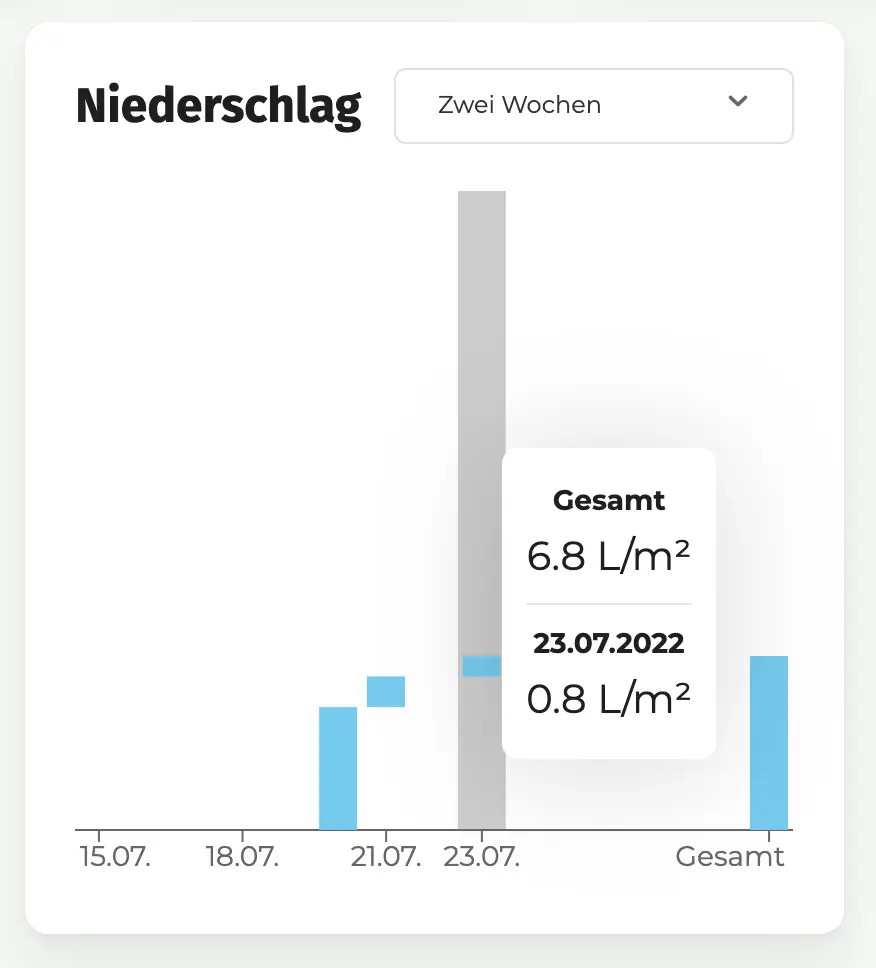
For the precipitation history, VineForecast uses radar measurements (only in Germany), as these are more accurate than model data. The time period displayed can be selected using the dropdown in the top right of the box Precipitation change. The values can be changed for a period of one week, two weeks, one month and since the last spraying are displayed.
If you move your mouse pointer over the diagram on your PC or your finger on your mobile phone, you will see two values. The lower value shows the amount of precipitation on the selected day. The upper value shows the amount of precipitation that fell between the first and the selected day (in the example below in the period from 15 July to 23 July). On the far right of the diagram you will find the total amount of precipitation for the selected period.
Leaf wetness 🌱
Leaf wetness is modelled by VineForecast, especially for the prediction of Downy Mildew. For the sake of simplicity, we only differentiate between wet and dry leaves. VineForecast calculates the maximum and minimum leaf wetness, including a safety margin, by comparing 40 weather models. You can find the leaf wetness data both on the homepage and under Forecasts -> Weather above in the small boxes. You can also view a detailed 24-hour forecast in the box Hourly weather view.
Wind 🌬
You can find details about the wind at Forecasts -> Weather in the box Hourly weather. In addition to the wind speed, you can also see the wind direction here.
Splash weather ⁉️
You can find out about the conditions for spraying both on the home page and at Forecasts -> Weather in the small boxes above. You will also find a detailed 24-hour forecast in the box Hourly weather.
VineForecast again uses traffic light colours and symbols for easy communication. Green symbols indicate a weather situation in which spraying should produce normal effectiveness. Yellow symbols indicate sufficient conditions for spraying. However, at least one variable is unfavourable for a good effect of the application. A red symbol indicates that at least two variables are unfavourable for a good effect of the application.
If you move your mouse pointer over the symbol on your PC or your finger on your mobile phone, a description of the exact meaning of the symbol will also appear (see image below).
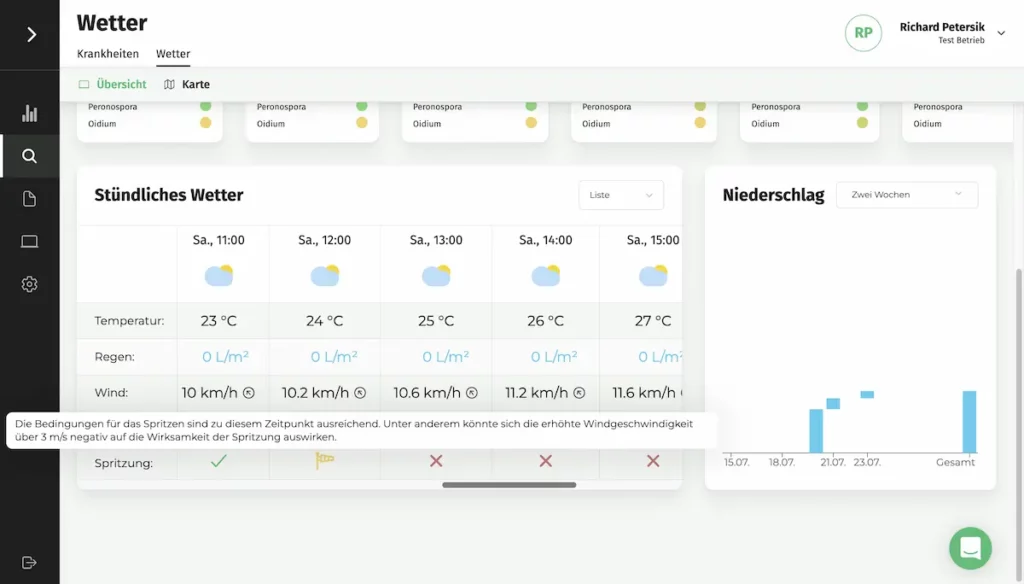
In the small boxes above you can see the daily summary of the weather data. For the spray weather, the condition that was calculated most frequently over the 24 hours of the day is always displayed here.